2015-Q4 Results released on website
PARADISE GAS CARRIERS CORP
Quarterly Management report
Date : 31/12/2015
Quarterly results (in USD thous.)| BALANCE SHEET (end of period) | 31/12/2014 (audited) | 31/3/2015 (unaudited) | 30/6/2015 (unaudited) | 30/9/2015 (unaudited) | 31/12/2015 (unaudited) | |||
| Cash & cash equivalents | 5,941 | 12,775 | 12,160 | 13,801 | 15,509 | |||
| Other Current Assets | 6,754 | 7,018 | 6,726 | 7,820 | 7,694 | |||
| Total Current Assets | 12,695 | 19,793 | 18,886 | 21,621 | 23,203 | |||
| Fixed Assets, net | 87,015 | 85,707 | 68,682 | 67,528 | 66,031 | |||
| Vessels under construction | 4,811 | 9,540 | 9,540 | 20,631 | 23,776 | |||
| Deferred drydocking costs | 1,240 | 3,442 | 3,476 | 3,505 | 4,709 | |||
| Other Non-Current Assets | 627 | 695 | 4,415 | 4,378 | 3,800 | |||
| Total Assets | 106,388 | 119,177 | 104,999 | 117,663 | 121,519 | |||
| Current portion of LT debt | 5,249 | 6,322 | 5,630 | 6,530 | 5,880 | |||
| Shareholders’ loans | 14,653 | 14,653 | 0 | 0 | 0 | |||
| Other current liabilities | 4,150 | 5,192 | 4,024 | 4,728 | 5,708 | |||
| Total Current Liabilities | 24,052 | 26,167 | 9,654 | 11,258 | 11,588 | |||
| Long-term debt | 20,436 | 29,181 | 22,965 | 31,433 | 30,025 | |||
| Other non-current liabilities | 0 | 0 | 1,800 | 1,800 | 1,800 | |||
| Total Liabilities | 44,488 | 55,348 | 34,419 | 44,491 | 43,413 | |||
| Paid-in capital | 61,500 | 62,850 | 65,970 | 66,000 | 68,750 | |||
| Retained Earnings | 400 | 979 | 4,610 | 7,172 | 9,356 | |||
| Shareholders Equity (Book NAV) | 61,900 | 63,829 | 70,580 | 73,172 | 78,106 | |||
| INCOME STATEMENT | 31/12/2014 (audited) | 2015/Q1 (unaudited) | 2015/Q2 (unaudited) | 2015/Q3 (unaudited) | 2015/Q4 (unaudited) | 31/3/2015 (YTD results) | 30/6/2015 (YTD results) | 30/9/2015 (YTD results) | 31/12/2015 (YTD results) | |
| Operating Revenue | 22,745 | 9,067 | 8,790 | 11,526 | 10,648 | 9,067 | 17,857 | 29,383 | 40,031 | |
| Less: Voyage Expenses | (5,469) | (691) | (131) | (86) | (289) | (691) | (822) | (908) | (1,197) | |
| Less: Commissions & Chartering Fees | (845) | (154) | (119) | (147) | (157) | (154) | (273) | (420) | (577) | |
| TCE Earnings (net) | 16,431 | 8,222 | 8,540 | 11,293 | 10,202 | 8,222 | 16,762 | 28,055 | 38,257 | |
| Operating expenses (excl. man fees) | (9,247) | (3,964) | (3,728) | (4,058) | (4,177) | (3,964) | (7,692) | (11,750) | (15,927) | |
| Management Fees (related parties) | (743) | (322) | (325) | (328) | (329) | (322) | (647) | (975) | (1,304) | |
| Charter hire expenses | – | – | (342) | (1,128) | (1,039) | – | (342) | (1,470) | (2,509) | |
| G+A Expenses | (377) | (65) | (34) | (75) | (141) | (65) | (99) | (174) | (315) | |
| EBITDA | 6,064 | 3,871 | 4,111 | 5,704 | 4,516 | 3,871 | 7,982 | 13,686 | 18,202 | |
| Depreciation | (3,491) | (1,341) | (1,277) | (1,153) | (1,497) | (1,341) | (2,618) | (3,771) | (5,268) | |
| Amortisation | (118) | (179) | (212) | (253) | (293) | (179) | (391) | (644) | (937) | |
| Gain on Vessels’ disposal, net* | – | – | 2,715 | (128) | – | – | 2,715 | 2,587 | 2,587 | |
| EBIT | 2,455 | 2,351 | 5,337 | 4,170 | 2,726 | 2,351 | 7,688 | 11,858 | 14,584 | |
| Interest & Finance Expences | (553) | (429) | (379) | (382) | (367) | (429) | (808) | (1,190) | (1,557) | |
| Other finance expenses | (161) | (122) | (338) | (110) | (100) | (122) | (460) | (570) | (670) | |
| Extraordinary & other expenses, net | (278) | (190) | 1 | (126) | (157) | (190) | (189) | (315) | (158) | |
| Net Income | 1,463 | 1,610 | 4,621 | 3,552 | 2,416 | 1,610 | 6,231 | 9,783 | 12,199 | |
| Out of book adj. (codification of borr cost) * |
41 | 27 | 294 | 286 | 110 | 27 | 321 | 607 | 717 | |
| Net Income adjusted | 1,504 | 1,637 | 4,915 | 3,838 | 2,526 | 1,637 | 6,552 | 10,390 | 12,916 | |
| Dividends distributed | – | 990 | 990 | 990 | 990 | 990 | 1,980 | 2,970 | 3,960 | |
| CASH FLOW STATEMENT (period) | 31/12/2014 (audited) | 31/3/2015 (unaudited) | 30/6/2015 (unaudited) | 30/9/2015 (unaudited) | 31/12/2015 (unaudited) | ||||
| Cash from Operations | 4,626 | 1,568 | 442 | 4,766 | 9,767 | ||||
| Cash from Investing | (57,276) | (4,803) | 15,228 | 4,137 | 1,142 | *PGC IKAROS was sold and leased back | |||
| Cash from Financing | 52,138 | 10,070 | (9,451) | (1,043) | (1,341) | ||||
| Change of cash in periods | (512) | 6,835 | 6,219 | 7,860 | 9,568 | ||||
| FY14 | 2015q1 | 2015q2 | 2015q3 | 2015q4 | |||||
| Loan repayments (net**) | (1,065) | (1,183) | (1,356) | (1,633) | (2,058) | **Net of refinancing proceeds/prepayments | |||
| STATISTICS (during quarter) | 12m2014 | 2015/Q1 | 2015/Q2 | 2015/Q3 | 2015/Q4 | ||||
| Average # of Ships Owned during Period | 3.7 | 6.0 | 6.0 | 6.0 | 6.0 | ||||
| Average Age of Fleet at end of Period | 12.4 | 12.7 | 12.9 | 13.2 | 13.4 | ||||
| ShipYears Left | 63.5 | 62.0 | 60.6 | 59.0 | 57.5 | Assumed 26 yrs for LPG’s and 20 for Tankers | |||
| Fleet Valuation ($mill) – end period | 104.2 | 107.3 | 89.7 | 100.8 | 104.2 | VesselsValue.com (PGC Ikaros has been sold) | |||
| Leverage | 24.6% | 33.1% | 31.9% | 37.7% | 34.5% | excl. shareholders’ loans | |||
| Market NAV ($mill) (1) | 73.1 | 72.4 | 78.5 | 82.3 | 87.8 | See note 1 below | |||
| Paid-in capital ($mill) | 61.5 | 62.85 | 66.6 | 66.0 | 68.8 | ||||
| Enterprise Value (EV) | 107.48 | 109.80 | 94.98 | 106.50 | 108.21 | EV = Market NAV plus debt (incl. SH loans) less cash | |||
| Book NAV per 100 usd invested ($) | 100.65 | 101.56 | 106.99 | 110.87 | 113.61 | Book NAV divided by paid-in capital | |||
| Market NAV per 100 usd invested ($) | 118.83 | 115.22 | 119.06 | 124.75 | 127.73 | Market NAV divided by paid-in capital | |||
| Dividends received per 100usd invested ($) | 0.00 | 1.58 | 3.07 | 4.57 | 6.01 | cumulative dividends received for 100 usd invested | |||
| RoE (annualised)* | 2.4% | 10.4% | 29.3% | 21.4% | 13.4% | *Net Income/Total equity (average of last period), includes capital gain | |||
| RoA (annualised)* | 1.4% | 5.8% | 17.5% | 13.8% | 8.4% | *Net Income/Total Assets (average of last period), includes capital gain | |||
| EV/EBIT (annualised) * | 43.78 | 28.44 | 10.53 | 8.81 | 7.08 | *EV (today) / EBIT (TTM) | |||
| P/E* | 49.95 | 32.99 | 11.36 | 8.63 | 6.83 | *Market NAV/Net Earnings (TTM) | |||
| Dividend Yield * | 0.0% | 1.4% | 2.52% | 3.61% | 4.51% | *Dividends distributed in the last 12m (TTM)/Market NAV | |||
| Average TCE per Ship, net* | 13,788 | 17,134 | 16,774 | 20,458 | 19,252 | *Net of BB charter hires | |||
| Average Opex per Ship ($/pd), incl. man fees | 7,452 | 7,937 | 7,423 | 7,946 | 8,163 | incl. management fees | |||
| Average charter hire expense per Ship ($/pd) | 0 | 0 | 627 | 2,043 | 1,882 | BB charter-in hires | |||
| Average GA & other costs per Ship ($/pd) | 281 | 120 | 62 | 136 | 255 | ||||
| Average debt-service per ship ($/pd) | 1,207 | 2,984 | 3,177 | 3,649 | 4,393 | incl. debt-service, other finance costs as well as deferred finance charges | |||
| Cashflow TCE Breakeven per Ship | 8,911 | 11,042 | 11,289 | 13,774 | 14,694 | ||||
| Cashflow Margin | 54.2% | 55.2% | 48.6% | 48.5% | 31.0% | ||||
| Income Statement TCE Breakeven per Ship * | 11,134 | 12,194 | 12,612 | 13,273 | 13,905 | *excl. capital gain | |||
| Ownership Days (average) | 365.00 | 90.00 | 91.00 | 92.00 | 92.00 | ||||
| Available Days efficiency (2) | 88.9% | 88.9% | 93.2% | 100.0% | 96.0% | See note 2 below | |||
| Operating Days efficiency (3) | 83.0% | 88.9% | 92.8% | 100.0% | 94.4% | See note 3 below | |||
(2) Available Days Efficiency is the ratio of the days that the fleet was available for revenue generating; divided to the Ownership days
(3) Operating Days Efficiency is the ratio of the days the ships were actually employed (TC or Spot) and generating revenues (after deducting the off-hire days); divided to the Ownership days
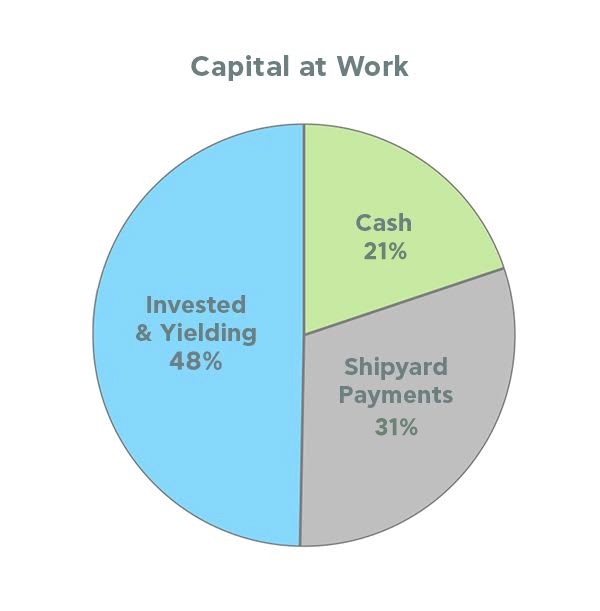
Capital at work
Net Asset Value of $100 Invested in PGC from the start

TCE vs cash / p&l b-even

- Management Report & Commentary Q1-2016

- Management Report & Commentary Q4-2015
- Management Report Q3-2015
- Unaudited 2015-Q3 Financial Statements
- Unaudited 2015-Q2 Financial Statements & Commentary
- Unaudited 2015-Q1 Financial Statements
- PGC Audited Financial Statements 2014
- Unaudited 2014-Q3 Financial Statements
- Management Report Q3-2014
- Unaudited 2014-Q2 Financial Statements
- Management Report & Commentary Q2-2014
- Management Report Q1-2014
- PGC Financial Statements 2013 audited by PWC