2016-Q1 Results released on website
PARADISE GAS CARRIERS CORP
Quarterly Management report
Date : 31/03/2016
Quarterly results (in USD thous.)| BALANCE SHEET (end of period) | 31/12/2015 (audited) | 31/3/2016 (unaudited) |
||||
| Cash & cash equivalents | 15,543 | 16,181 | ||||
| Other Current Assets | 6,557 | 9,265 | ||||
| Total Current Assets | 22,100 | 25,446 | ||||
| Fixed Assets, net | 66,031 | 64,785 | ||||
| Vessels under construction | 23,775 | 26,801 | ||||
| Deferred drydocking costs | 4,258 | 3,906 | ||||
| Other Non-Current Assets | 2,000 | 2,000 | ||||
| Total Assets | 118,164 | 122,938 | ||||
| Current portion of LT debt | 5,741 | 5,118 | ||||
| Shareholders’ loans | 0 | 0 | ||||
| Other current liabilities | 5,284 | 4,786 | ||||
| Total Current Liabilities | 11,025 | 9,904 | ||||
| Long-term debt | 29,639 | 28,656 | ||||
| Other non-current liabilities | 1,581 | 1,581 | ||||
| Total Liabilities | 42,245 | 40,141 | ||||
| Paid-in capital | 68,750 | 71,500 | ||||
| Retained Earnings | 7,169 | 11,297 | ||||
| Shareholders Equity (Book NAV) | 75,919 | 82,797 | ||||
| INCOME STATEMENT | 31/12/2015 (audited) |
2016/Q1 (unaudited) |
31/3/2016 (YTD results) |
|||
| Operating Revenue | 40,002 | 11,203 | 11,203 | |||
| Less: Voyage Expenses | (1,190) | (351) | (351) | |||
| Less: Commissions & Chartering Fees | (580) | (190) | (190) | |||
| TCE Earnings (net) | 38,232 | 10,662 | 10,662 | |||
| Operating expenses (excl. man fees) | (16,099) | (3,452) | (3,452) | |||
| Management Fees (related parties) | (1,304) | (328) | (328) | |||
| Charter hire expenses | (2,509) | (1,039) | (1,039) | |||
| G+A Expenses | (301) | (62) | (62) | |||
| EBITDA | 18,019 | 5,781 | 5,781 | |||
| Depreciation | (5,313) | (1,246) | (1,246) | |||
| Amortisation | (940) | (360) | (360) | |||
| Gain on Vessels’ disposal, net* | 392 | 165 | 165 | |||
| EBIT | 12,158 | 4,340 | 4,340 | |||
| Interest & Finance Expences | (1,684) | (419) | (419) | |||
| Other finance expenses | (501) | (10) | (10) | |||
| Extraordinary & other expenses, net | 38 | 58 | 58 | |||
| Net Income | 10,011 | 3,969 | 3,969 | |||
| Out of book adj. (codification of borr cost) * | 718 | 138 | 138 | |||
| Net Income adjusted | 10,729 | 4,107 | 4,107 | |||
| Dividends distributed | 3,960 | 1,073 | 1,073 | |||
| CASH FLOW STATEMENT (period) | 31/12/2015 (audited) | 31/3/2016 (unaudited) | ||||
| Cash from Operations | 11,151 | 4,598 | ||||
| Cash from Investing | (616) | (2,909) | *PGC IKAROS was sold and leased back | |||
| Cash from Financing | (933) | 1,051 | ||||
| Change of cash in periods | 9,603 | 638 | ||||
| FY15 | 2016q1 | |||||
| Loan repayments (net**) | (6,280) | (1,633) | **Net of refinancing proceeds/prepayments | |||
| STATISTICS (during quarter) | 12m2015 | 2016/Q1 | ||||
| Average # of Ships Owned during Period | 6.0 | 6.0 | incl. chartered-in vessels | |||
| Average Age of Fleet at end of Period | 13.4 | 13.7 | ||||
| ShipYears Left | 57.5 | 56.0 | Assumed 26 yrs for LPG’s and 20 for Tankers | |||
| Fleet Valuation ($mill) – end period | 104.1 | 103.0 | FMV: VesselsValue.com(adj as per note 1),incl. NB advances | |||
| Leverage | 28.0% | 26.3% | Total Dept / (FMV incl. NB advances + Currect Assets) | |||
| Market NAV ($mill) (1) | 86.0 | 90.4 | See note 1 below | |||
| Paid-in capital ($mill) | 68.8 | 71.5 | ||||
| Enterprise Value (EV) | 105.80 | 107.95 | EV = Market NAV plus debt less cash | |||
| Book NAV per 100 usd invested ($) | 110.43 | 115.80 | Book NAV divided by paid-in capital | |||
| Market NAV per 100 usd invested ($) | 125.04 | 126.37 | Market NAV divided by paid-in capital | |||
| Dividends received per 100usd invested ($) | 6.0 | 6.0 | 12m cumulative dividends received for 100 usd invested | |||
| RoE (annualised)* | 15.6% | 20.7% | *Net Income/Total equity (average of last period), includes capital gain | |||
| RoA (annualised)* | 9.6% | 13.6% | *Net Income/Total Assets (average of last period), includes capital gain | |||
| EV/EBIT (annualised) * | 8.23 | 7.63 | *EV (today) / EBIT (TTM) | |||
| P/E* | 8.06 | 7.30 | *Market NAV/Net Earnings (TTM) | |||
| Dividend Yield * | 4.61% | 4.47% | *Dividends distributed in the last 12m (TTM)/Market NAV | |||
| Average TCE per Ship, net* | 18,461 | 19,527 | *Net of BB charter hires | |||
| Average Opex per Ship ($/pd), incl. man fees | 7,947 | 6,923 | incl. management fees | |||
| Average charter hire expense per Ship ($/pd) | 1,146 | 1,903 | BB charter-in hires | |||
| Average GA & other costs per Ship ($/pd) | 137 | 114 | ||||
| Average debt-service per ship ($/pd) | 3,637 | 3,757 | incl. debt-service, other finance costs as well as deferred finance charges | |||
| Cashflow TCE Breakeven per Ship | 12,866 | 12,697 | includes charter-in costs (approx. $2k/pd) | |||
| Cashflow Margin | 43.5% | 53.8% | includes charter-in costs | |||
| Income Statement TCE Breakeven per Ship * | 12,737 | 12,308 | *excl. capital gain | |||
| Ownership Days (average) | 365.00 | 91.00 | ||||
| Available Days efficiency (2) | 94.6% | 100.0% | See note 2 below | |||
| Operating Days efficiency (3) | 94.1% | 100.0% | See note 3 below | |||
(2) Available Days Efficiency is the ratio of the days that the fleet was available for revenue generating; divided to the Ownership days
(3) Operating Days Efficiency is the ratio of the days the ships were actually employed (TC or Spot) and generating revenues (after deducting the off-hire days); divided to the Ownership days
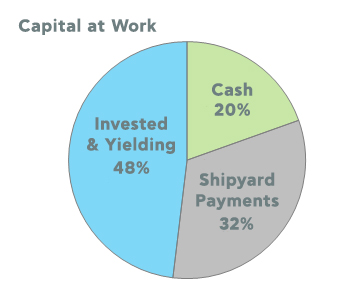
Capital at work
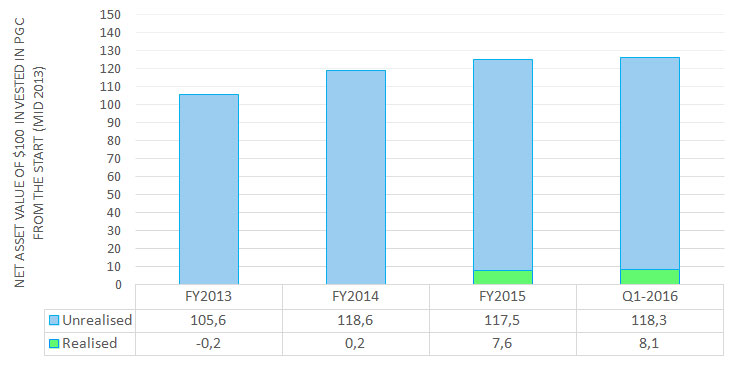
Net Asset Value of $100 Invested in PGC from the start
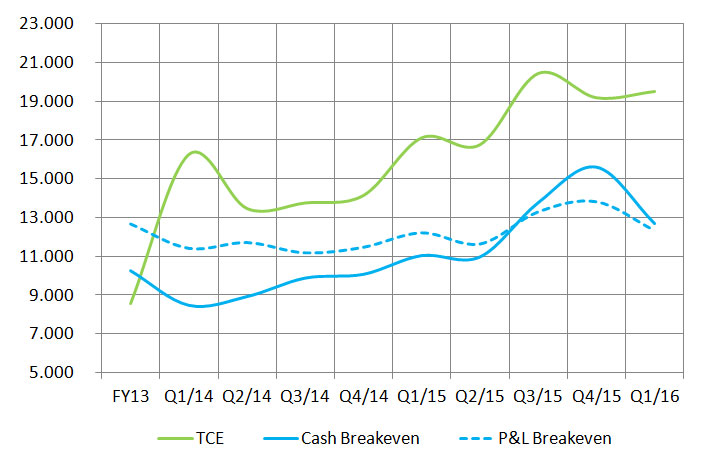
TCE vs cash / p&l b-even
- PGC Audited Financial Statements 2015

- Management Report & Commentary Q1-2016
- Management Report & Commentary Q4-2015
- Management Report Q3-2015
- Unaudited 2015-Q3 Financial Statements
- Unaudited 2015-Q2 Financial Statements & Commentary
- Unaudited 2015-Q1 Financial Statements
- PGC Audited Financial Statements 2014
- Unaudited 2014-Q3 Financial Statements
- Management Report Q3-2014
- Unaudited 2014-Q2 Financial Statements
- Management Report & Commentary Q2-2014
- Management Report Q1-2014
- PGC Financial Statements 2013 audited by PWC